People are digging TerminalWidget, which I’m both surprised and delighted by. I really wasn’t sure people would “get” it when I first started working on it (all the way up to the day I launched it). The most common review, though, is some form of “this looks awesome but I don’t know what to do with it.”
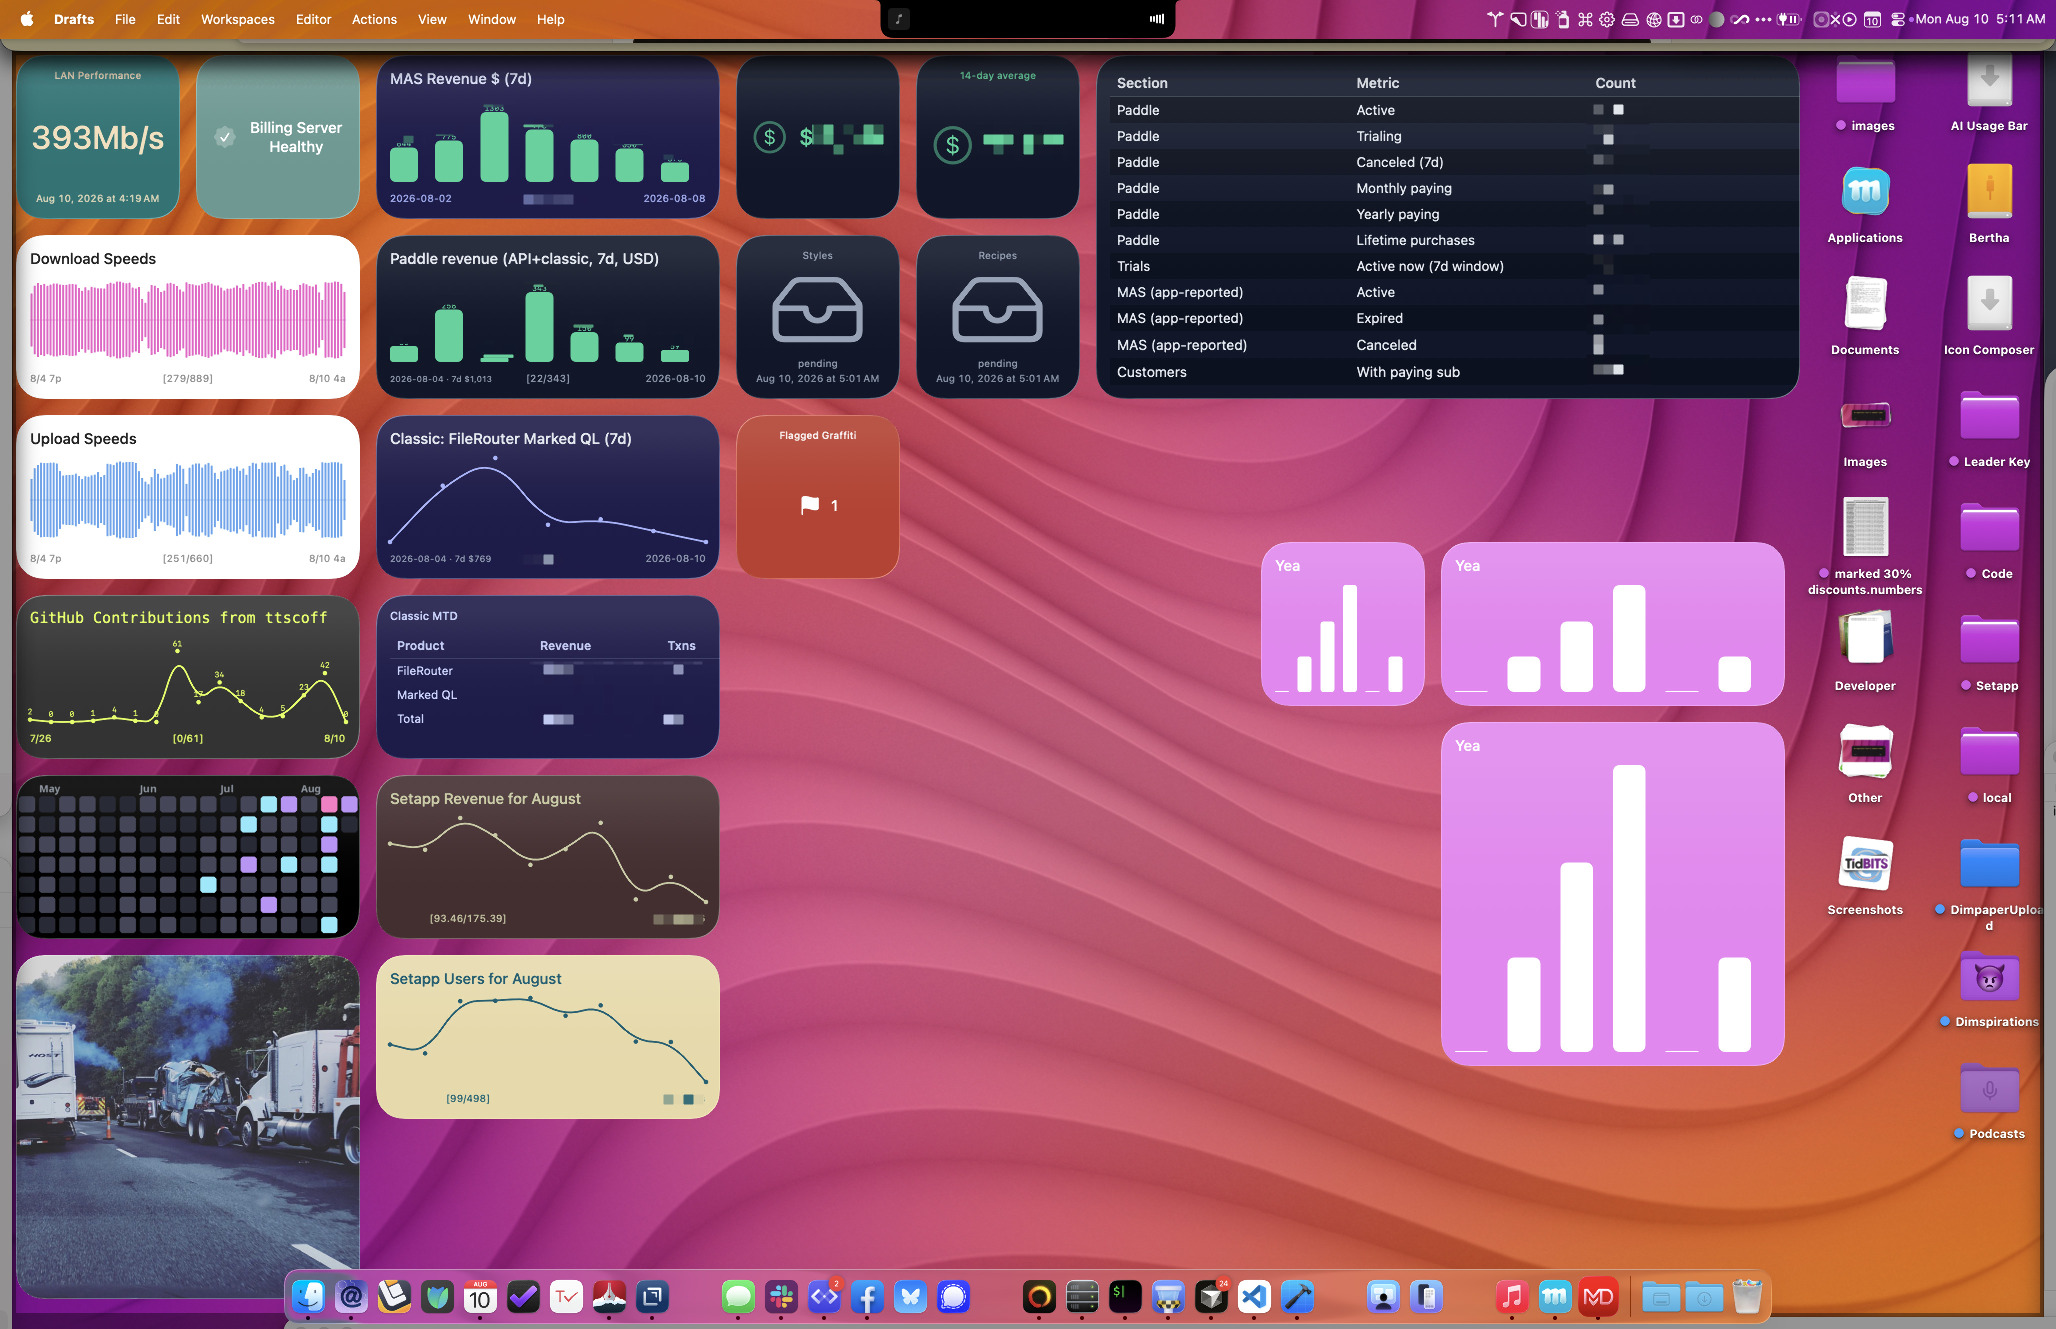
I’m sharing my personal dashboard in this post as a concrete example of what can be done. There are a hundred ways to use TerminalWidget, but that kind of flexibility can be overwhelming. So here’s what I do to have all of this information visible with just a spread of my fingers on the trackpad (or hitting F11).
Click around the image to see details on each widget in a box below
it1.
Tap a widget to see how it updates.
Network Health
Uses iperf3 to measure the network speed between my MBP and my Synology as a test of LAN performance. Bash shell script that runs once per hour via launchd.
Billing Server Health
I built a custom billing server for Marked 3, and the API at billing.markedapp.com has a custom health endpoint that just checks whether the API server is up and running. This widget is a Bash script that runs every 5 minutes (launchd) and turns red with an error icon when it fails.
Network Speeds
This widget is a bash script that uses networkQuality (built into macOS) to test my upload and download speeds once per hour. It records the results in a CSV file that can then be used to update terminal-widget with chart data for historical speeds.
GitHub Contributions
I like to see my GitHub activity, so the top widget uses the GitHub API to graph activity, and the bottom widget uses my own https://brettterpstra.com/contrib API to generate a nice image with month labels, showing a broader range than the 14 day chart on top. The bottom widget just uses a Contrib image URL to display the image.
Flickr Image
Yes, I still use Flickr. Not as much as I used to, but I have a ton of images from the last decade in there, and this widget uses the Flickr API (via Python) with my own API key to grab a random image from my own public account. Refreshes every hour (launchd) and clicking the image runs a Shortcut that refreshes the image with a new random one.
Mac App Store Revenue
This shows my Mac App Store earnings across all of my apps that are available on the MAS, broken down by day (chart format bar), with a high/low caption. I use the border radius feature of terminal-widget to make the graphs look nicer. Ruby script run with launchd.
Paddle Revenue
This widget shows my 7-day Paddle revenue, with start and end dates and high/low caption. This information is pulled from the Paddle API, but stored in a local data file so I don't have to ping the API for historical data after a day is finished. Ruby script run with launchd.
Paddle Classic Revenue
Some of my apps are only available on Paddle Classic, so these charts break down just those sales by app. Ruby script run with launchd.
Setapp Stats
These two widgets show my Setapp stats (revenue, users) since the start of the month using chart type "smooth." This one is tricky because Setapp doesn't offer an API to developers (yet), so I have to use a Puppeteer instance to keep my login token up to date and then scrape the CSV downloads they do provide. Python script run once an hour with launchd.
User Contribution Notifications
These 3 widgets show me when someone submits a Marked Custom Style that needs approval, a TerminalWidget Recipe that needs review, or a Graffiti Moe spray that gets flagged by the auto-review or another user. Clicking each widget opens the respective admin page using --action-type open-url and --action-target with the admin URL. Bash scripts run at 15 minute intervals with launchd.
MTD Revenue and Daily Average
The left widget shows my total revenue for the month, totalling up Paddle, MAS, and Setapp revenues. The right widget shows the average daily revenue for the last 14 days. Single Ruby script updates both at the same time using sales history compiled by the other scripts.
Subscription Breakdown
Stats pulled from Paddle and MAS (AppFigures) showing my total number of subscribers and active trials. Output as CSV data and fed into a table widget. This one showcases the brand new "Extra Large" format widget that I just added yesterday. Ruby script run with launchd.
Screenshot Capture Targets
These 3 widgets are just used for my automated screenshot capture. I have a manually-run Ruby script that runs through every possible chart/widget type, updates the widget, and captures and labels a screenshot.
Almost every one of these widgets was created with the help of my AI
agent. You don’t have to learn all of the ins and outs of TerminalWidget
to make a beautiful and useful dashboard. Just point your agent at the
documentation and tell it what you want to display/chart/graph.
If you haven’t checked out TerminalWidget yet, you can see how it works,
get recipes, and preview every widget type at
terminalwidget.app.
This took some doing, by the way. I built a tool that allowed
me to drag zones onto the image, add ids and descriptions, and then
output a YAML file I could use in a Jekyll include to describe each
widget. I don’t know if I’ll ever use it again, but it was kind of a
fun project this morning. ↩