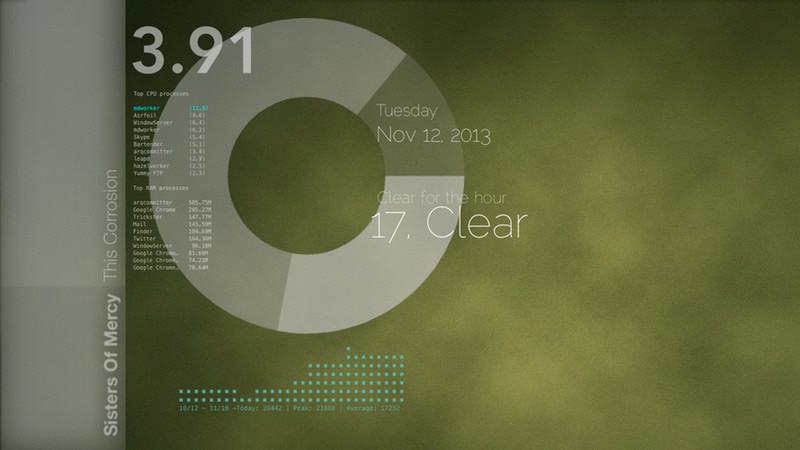
This is a script I’m using with GeekTool to output a bar chart of stats for my blog to my desktop. It’s specifically geared toward the data returned by FeedPress, but I’m posting it because it can pretty easily be modified to work with any date-based data set. The concept is actually easy enough to use with any sequential data, and can be modified to output horizontal bars as well.
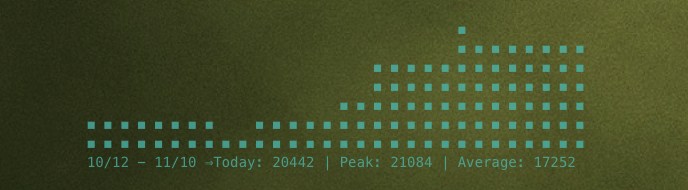
It parses through a JSON data object (requires the JSON gem) containing a set of objects with dates and counts, creating an array of dates and totals, one for each day (or whatever increments the data provides). It then outputs one row at a time, determining whether each column has a high enough total to generate a block in that level of the bar. You can set a maximum number of columns and a max height that will scale based on the high and low numbers in the data set.
Note that you’ll need to use a fixed-width font to display this.
There’s sample data from the FeedPress API at the bottom of the script that you can use to compare with other data sources and adjust the script accordingly. Feel free to copy or fork the script on GitHub; I’d love to see what you do with it.